The short answer
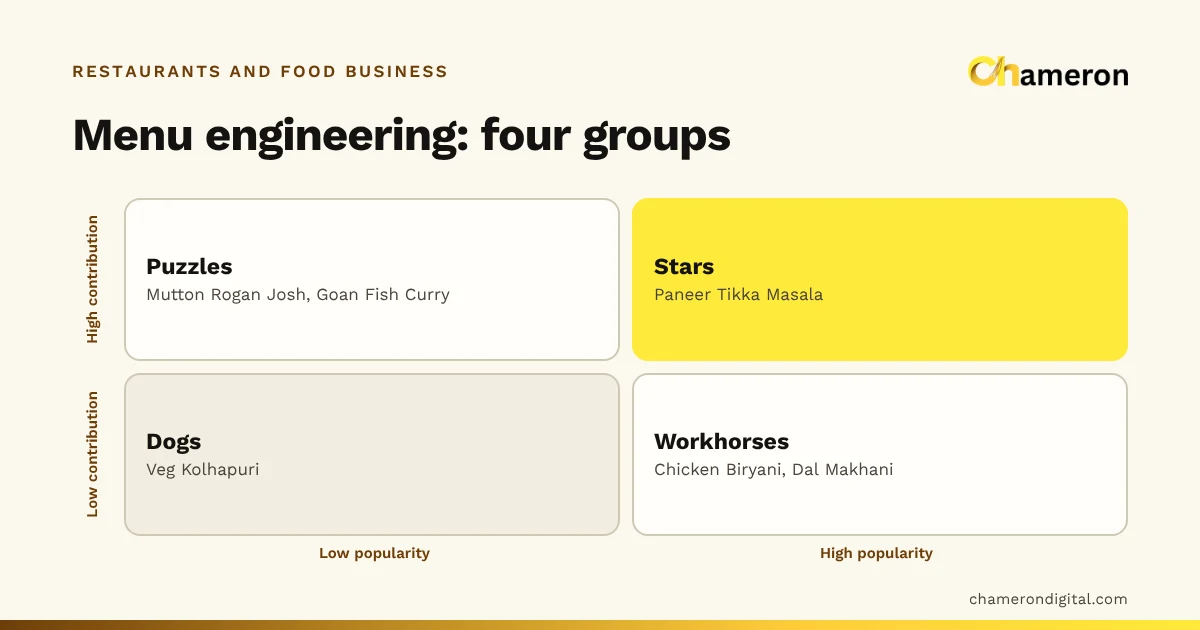
Menu profitability comes down to two numbers for each dish: how much it contributes per plate and how often it sells. Contribution is the menu price before GST minus the food cost of one portion. Popularity is the dish's share of all portions sold in its category. Compare both with the category average and every dish falls into one of four groups (stars, workhorses, puzzles and dogs), each of which calls for a different decision. This method is usually called menu engineering.
The two numbers behind every dish
Contribution is in rupees, not a percentage, and that is deliberate. Your wages, rent and electricity are paid in rupees. A dish that leaves ₹266 on every plate does more for those bills than one that leaves ₹169, whatever their food cost percentages say.
Popularity is measured within a category (mains, starters, breads, beverages, desserts) because those are the dishes that compete for the same choice. A guest choosing a main is not weighing it against a lassi.
If you do not yet have a food cost for each dish, cost the recipes first. Our guide to calculating restaurant food cost shows how to cost a plate ingredient by ingredient.
Step 1: gather a month of data
For each dish in the category you need three things:
- Menu price before GST. GST collected is not your income, so leave it out.
- Food cost per portion from the recipe, at current ingredient prices. For takeaway and delivery, add the packaging.
- Portions sold over the period, ideally at least four weeks. Your billing software's item report, or a tally from KOT books, gives this.
Take the same period for every dish. If a dish was off the menu for a week, note it, because its popularity will look lower than it really is.
Step 2: calculate contribution and popularity
Here is one month of mains at an invented North Indian restaurant. In total, 1,750 mains were sold.
| Dish | Price | Food cost | Contribution | Sold | Mix % | Total contribution |
|---|---|---|---|---|---|---|
| Paneer Tikka Masala | ₹320 | ₹96 | ₹224 | 410 | 23.4% | ₹91,840 |
| Chicken Biryani | ₹340 | ₹136 | ₹204 | 520 | 29.7% | ₹1,06,080 |
| Dal Makhani | ₹240 | ₹60 | ₹180 | 460 | 26.3% | ₹82,800 |
| Mutton Rogan Josh | ₹460 | ₹207 | ₹253 | 90 | 5.1% | ₹22,770 |
| Veg Kolhapuri | ₹260 | ₹91 | ₹169 | 120 | 6.9% | ₹20,280 |
| Goan Fish Curry | ₹380 | ₹114 | ₹266 | 150 | 8.6% | ₹39,900 |
| Total | 1,750 | 100% | ₹3,63,670 |
Each row is simple arithmetic. For the biryani: ₹340 − ₹136 = ₹204 contribution; 520 ÷ 1,750 = 29.7% of mains; ₹204 × 520 = ₹1,06,080 for the month.
Step 3: set the two thresholds
To call a dish "high" or "low" on each measure you need a dividing line.
Average contribution: ₹3,63,670 ÷ 1,750 = ₹207.81. This is a weighted average: popular dishes count for more, which is what you want, because it reflects what an average plate actually earned.
Popularity threshold: with six dishes, an equal share would be 100% ÷ 6 = 16.7%. The common convention is to treat a dish as popular if it reaches 70% of that equal share: 16.7% × 0.7 = 11.7%, or about 204 portions in this month. The 70% figure is a rule of thumb, not a law. Some owners use the full equal share, which is stricter. Whichever you choose, use it consistently from one analysis to the next.
Step 4: sort the dishes into four groups
Compare each dish with the two thresholds:
| Group | Contribution | Popularity | Dishes in the example |
|---|---|---|---|
| Star | Above ₹207.81 | Above 11.7% | Paneer Tikka Masala (₹224, 23.4%) |
| Workhorse | Below | Above | Chicken Biryani (₹204, 29.7%), Dal Makhani (₹180, 26.3%) |
| Puzzle | Above | Below | Mutton Rogan Josh (₹253, 5.1%), Goan Fish Curry (₹266, 8.6%) |
| Dog | Below | Below | Veg Kolhapuri (₹169, 6.9%) |
You will see other names for these groups (workhorses are sometimes called plowhorses), but the logic is the same.
What to do with each group
Stars: protect them
Stars sell well and earn well. Keep the recipe and portion consistent, keep them in a prominent place on the menu, and be careful with price increases. Paneer Tikka Masala is the dish to train every new cook on first.
Workhorses: lift the contribution
Workhorses bring the volume. The aim is to earn a little more from each plate without putting guests off. Options are a modest price increase, a smaller costly component, or pairing the dish with a high-contribution side.
A price rise is easy to test with one formula: how many portions can you lose before the rise stops paying?
Puzzles: sell more of them
Puzzles earn well but few people order them. Try a better position on the menu, a clearer description, a staff recommendation, a smaller portion at a lower price, or a combo. Mutton is expensive, so check the price is not simply too high for your guests; a ₹460 dish on a menu where most mains are near ₹300 can look out of place.
Dogs: rework, replace or keep for a reason
Dogs earn little and sell little. Before removing one, ask what it does for the menu. Veg Kolhapuri may be one of very few vegetable mains. If it goes, where will its buyers go?
If all 120 of its monthly buyers chose Dal Makhani instead, contribution on those plates would rise from ₹169 to ₹180: 120 × ₹11 = ₹1,320 more a month, and one less recipe to stock. If they left for another restaurant, you would lose ₹20,280 of contribution. The truth usually sits in between, so try reworking the recipe or price first and watch the next month's numbers.
Why food cost percentage alone misleads
In the example, Chicken Biryani has the highest food cost percentage on the list: ₹136 ÷ ₹340 = 40%. Dal Makhani has the lowest: ₹60 ÷ ₹240 = 25%. Judged by food cost percentage, the dal looks like the better dish.
But the biryani contributes ₹24 more per plate (₹204 against ₹180), sells more, and brings in ₹1,06,080 a month against the dal's ₹82,800. Cutting the biryani's price or portion to "fix" its food cost could lose far more rupees than it saves in percentage points.
Food cost percentage is still useful for spotting recipes that have drifted or prices that have fallen behind costs. Just do not rank dishes by it. The difference is explained fully in food cost percentage vs profit margin, and the short version is in what is food cost percentage.
Common mistakes
- Mixing categories. Comparing chai with mutton curry puts every beverage in the dog quadrant.
- Using prices with GST. It inflates every contribution and makes the comparison with costs meaningless.
- Stale recipe costs. If onion or chicken prices have moved since the recipes were costed, the contributions are wrong. Recost the main ingredients first.
- Ignoring packaging for delivery dishes. A container and bag can turn a star into a workhorse on delivery orders.
- Too short a period. One week, or a week with a festival or a cricket final, gives a distorted mix.
- Acting on every result at once. Change a few dishes, then measure again, so you know which change worked.
Doing this in software
The analysis needs only a spreadsheet, but the inputs are easier to trust when they come from your billing records. If each menu item holds both its price and its cost, an item sales report for the month gives you the portions sold, and the rest is the arithmetic above. In DINE OS, menu items carry a price and a cost and can be linked to their recipes, and the reports include sales by product; the menu and recipes page shows how the menu is set up.
The bottom line
Menu profitability is contribution multiplied by popularity. Work out what each dish leaves per plate before GST, see how often it sells within its category, compare both with the average, and act on each group differently: protect stars, lift workhorses, promote puzzles and question dogs. To set a price for a target food cost before you run the numbers, use the menu price calculator, and check any dish's figures with the food cost calculator.
Questions people ask
What is contribution margin for a dish?
It is the menu price before GST minus the cost of the ingredients (and packaging, for takeaway) in one portion. A ₹340 biryani that costs ₹136 to make contributes ₹204. See what is contribution margin.
How often should I do a menu engineering analysis?
Once a quarter suits most restaurants, and again whenever you change the menu or a major ingredient price moves. Use at least a month of sales so one festival weekend or slow week does not distort the picture.
Should I remove every dish in the 'dog' quadrant?
Not automatically. A dish may be the only option for vegetarian, Jain or children's orders, and removing it could lose the whole table. Check what it does for the menu before you cut it, and try reworking the recipe or price first.
Should I analyse the whole menu together?
No. Compare dishes within the same category, such as mains with mains and beverages with beverages. A ₹40 chai and a ₹460 mutton curry are not competing for the same order.
Do delivery orders need a separate analysis?
If delivery is a large part of your sales, yes. Packaging adds to the cost of each portion, and any commission you pay reduces what you keep, so the same dish can fall into a different quadrant for delivery.