The short answer
Food cost percentage tells you how much of each sale goes on ingredients. Profit margin tells you how much of each sale you keep after costs. A dish that costs ₹96 to make and sells for ₹320 has a 30% food cost, which leaves a 70% gross margin. But the restaurant's net profit margin, after wages, rent, gas, power and everything else, might be closer to 10%. You need both numbers: food cost to control the kitchen, and profit margin to know whether the business is working.
Two numbers, two questions
Both measures divide something by sales, which is why they get mixed up. What they divide is different.
Food cost percentage answers a kitchen question: are we using ingredients the way we planned? Net profit margin answers an owner's question: after paying for everything, what is left from each ₹100 a guest spends?
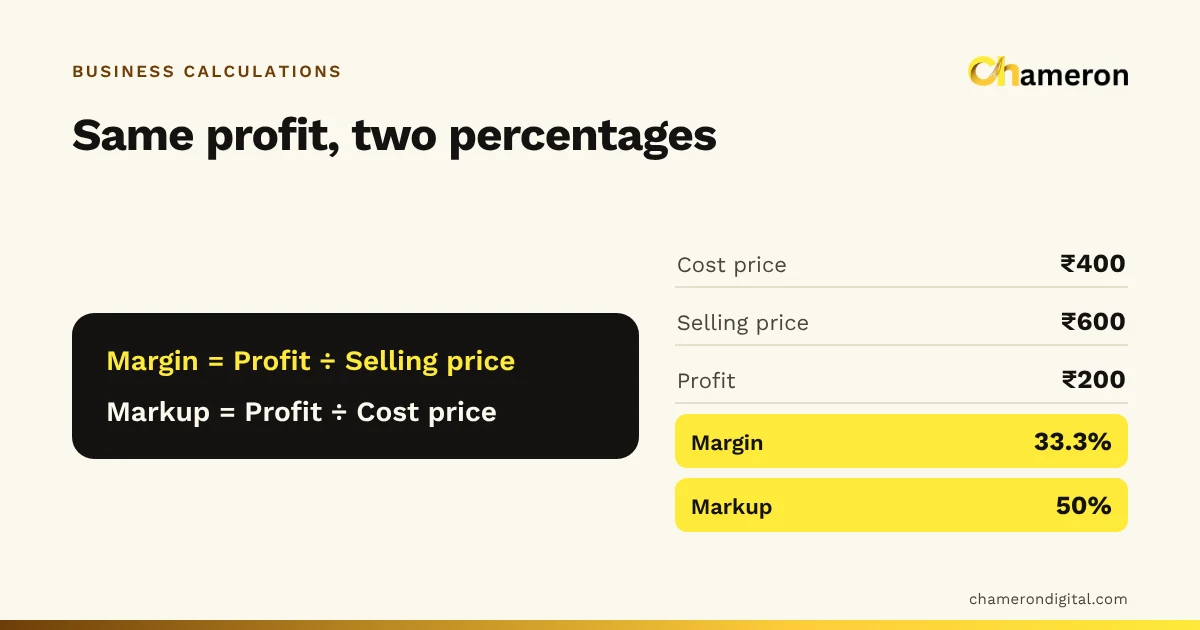
A third measure sits between them. Markup compares profit with cost instead of with the price. The profit margin vs markup guide explains that difference in detail; for restaurants, the main thing to remember is that a 30% food cost is the same as a 233% markup on ingredients, which sounds generous until you see what else the gross profit has to pay for.
One dish, every number
Take a plate of paneer tikka. The recipe uses ₹96 of ingredients at today's purchase prices, and the menu price is ₹320 before GST.
| Measure | Calculation | Result |
|---|---|---|
| Food cost % | ₹96 ÷ ₹320 × 100 | 30% |
| Gross profit per plate | ₹320 − ₹96 | ₹224 |
| Gross margin % | ₹224 ÷ ₹320 × 100 | 70% |
| Markup on ingredients | ₹224 ÷ ₹96 × 100 | 233.3% |
All four describe the same plate. None of them yet says whether the restaurant makes money on it, because the ₹224 still has to cover a share of the cook's wages, the rent, the gas and the electricity bill.
The food cost calculator works these out for any dish, and the margin and markup calculator gives the margin and markup views of the same numbers.
One month, every number
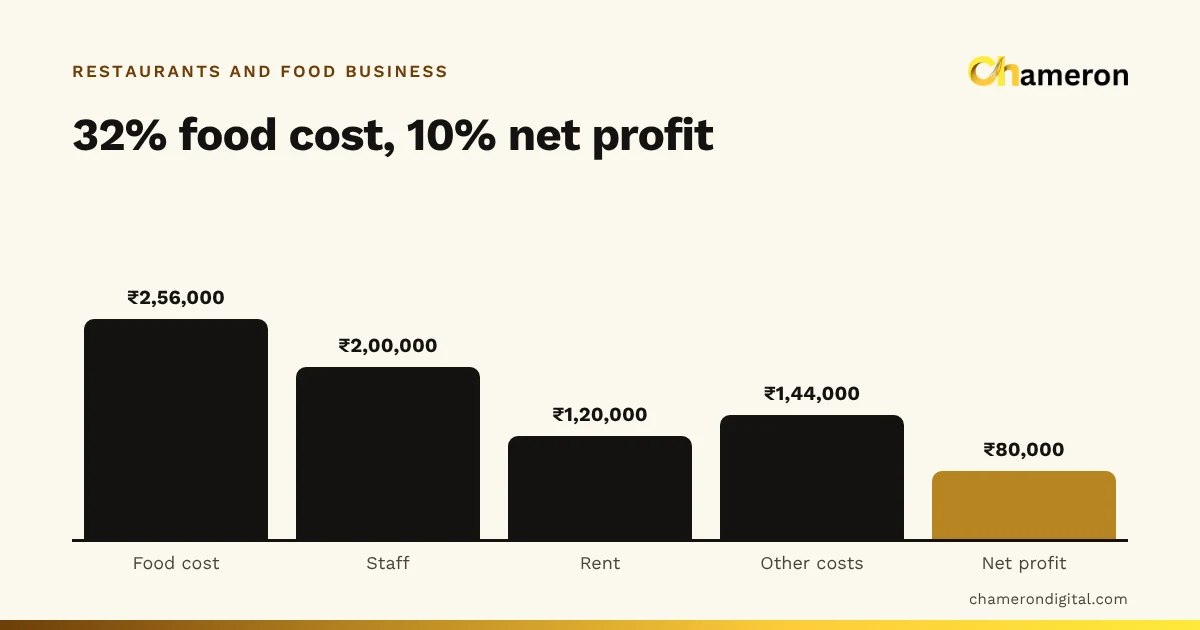
Profit margin only becomes meaningful at the level of the whole business. Here is an invented month for a 60-seat restaurant that also does takeaway and delivery. All figures are before GST.
| Line | Amount | % of sales |
|---|---|---|
| Sales | ₹8,00,000 | 100% |
| Food cost (from stock used) | ₹2,56,000 | 32% |
| Gross profit after food | ₹5,44,000 | 68% |
| Staff wages and meals | ₹2,00,000 | 25% |
| Rent | ₹1,20,000 | 15% |
| Gas, power and water | ₹56,000 | 7% |
| Packaging | ₹24,000 | 3% |
| Repairs, marketing, software and other | ₹64,000 | 8% |
| Net profit | ₹80,000 | 10% |
The food cost percentage is 32%. The net profit margin is 10%. Both are correct, and they describe completely different things. The 68% gross margin is not profit; it is the money available to run the restaurant, and most of it is spent before the month ends.
Why small food cost changes hit profit hard
Food cost moves with sales; rent does not. So when food cost rises, there is nothing on the other side of the table to absorb it.
Suppose a run of price increases from suppliers and some careless portioning push the same restaurant's food cost from 32% to 34%, with sales unchanged at ₹8,00,000:
| Before | After | |
|---|---|---|
| Food cost % | 32% | 34% |
| Food cost | ₹2,56,000 | ₹2,72,000 |
| Other costs | ₹4,64,000 | ₹4,64,000 |
| Net profit | ₹80,000 | ₹64,000 |
| Net profit margin | 10% | 8% |
A two-point rise in food cost took ₹16,000, one fifth of the month's profit. This is why the food cost percentage deserves a weekly look even though the profit margin is the number that pays the owner. The reverse is also true: bringing food cost back down two points by fixing portions and waste adds the full ₹16,000 straight to profit, without a single extra guest.
A low percentage is not the same as high profit
Food cost percentage is excellent for spotting a problem with a recipe or a supplier. It is a poor way to choose which dishes to push, because the restaurant banks rupees, not percentages.
| Dish | Price | Ingredient cost | Food cost % | Gross profit per plate |
|---|---|---|---|---|
| Masala chai | ₹40 | ₹8 | 20% | ₹32 |
| Dal makhani | ₹260 | ₹52 | 20% | ₹208 |
| Paneer tikka | ₹320 | ₹96 | 30% | ₹224 |
| Mutton rogan josh | ₹480 | ₹168 | 35% | ₹312 |
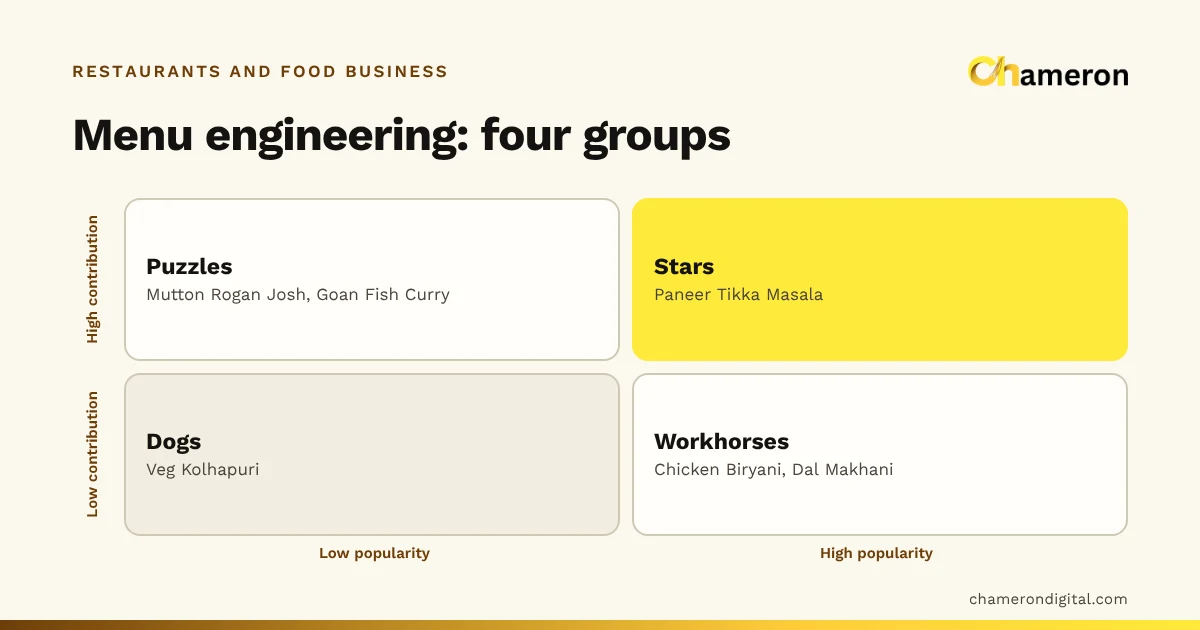
The mutton dish has the "worst" food cost percentage and the best rupee contribution per plate. Replacing a mutton order with a dal order lowers the restaurant's food cost percentage and lowers its profit at the same time.
Volume matters too. If the restaurant sells 300 dal makhani and 150 rogan josh in a month, the dal earns ₹62,400 of gross profit and the mutton ₹46,800, so the dal is the bigger contributor overall. Both views, per plate and per month, belong in a menu review. Our guide to menu profitability covers how to combine them, and the question page on contribution margin explains the idea behind ranking by rupees.
Recipe food cost vs actual food cost
There are two ways to measure food cost, and the gap between them is one of the most useful numbers a restaurant has.
- Recipe (theoretical) food cost is what the food should have cost: each dish's recipe cost multiplied by the number sold.
- Actual food cost is what the kitchen really used, worked out from stock.
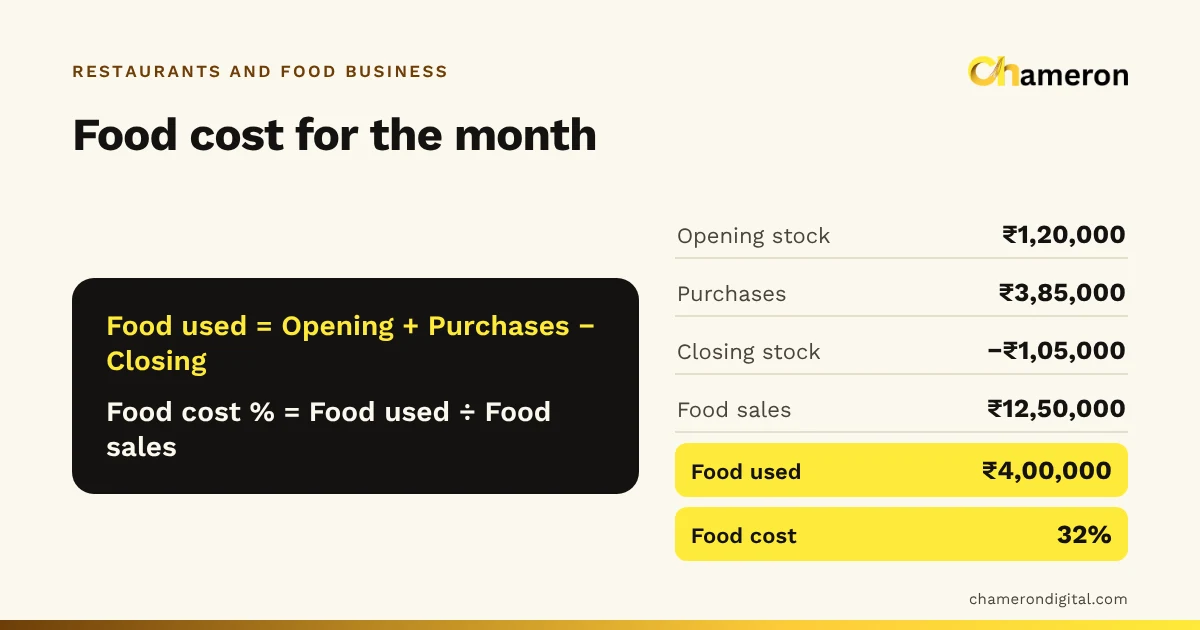
For the month above: opening stock ₹60,000 + purchases ₹2,50,000 − closing stock ₹54,000 = ₹2,56,000 used, which is 32% of ₹8,00,000.
Now suppose the recipes for everything sold that month add up to ₹2,40,000, a theoretical 30%. The two-point gap, ₹16,000, is food that was bought and used but never reached a bill: spoilage, over-portioning, mistakes sent back, staff meals that were not recorded, and anything that walked out of the back door. You cannot fix a gap you cannot see, which is why the restaurant food cost guide compares the two every period. Restaurant inventory management covers the counting side.
How discounts and delivery change both numbers
A discount does not change what the ingredients cost; it lowers the price. So it raises the food cost percentage and lowers the margin at once. A 10% discount on the ₹320 paneer tikka brings the price to ₹288. The ingredients still cost ₹96, so food cost rises to 33.3% and gross profit falls from ₹224 to ₹192.
Delivery orders carry extra costs that are not food but come out of the same gross profit: containers, bags, cutlery and any commission paid to a delivery platform. A dish can show an identical food cost percentage on the dine-in and delivery menus and still earn much less on delivery. If you sell through several channels, work out margin by channel, and consider whether delivery prices need to be set separately.
Common mistakes
- Reading 100% minus food cost as profit. A 30% food cost leaves 70% gross margin, not 70% profit. Most of it pays for staff, rent and utilities.
- Chasing the lowest food cost percentage. Cutting high-value dishes to bring the percentage down can lower total profit. Look at rupees per plate and plates sold.
- Using recipe cost as if it were actual cost. Recipes describe the plan. Stock counts show reality. Track both and watch the gap.
- Costing recipes once and forgetting them. When onion, oil or chicken prices move, every dish that uses them moves too. Recost the main dishes whenever a key ingredient changes noticeably.
- Mixing GST into the figures. Work with prices before GST on both sides, or the percentages will look better than they are.
- Leaving packaging out of delivery pricing. It is not food, but it is a cost of every delivery order.
Seeing both numbers in software
When every menu item carries a recipe and a cost, software can do the arithmetic that is tedious by hand: recipe cost per dish, stock used per sale, and reports by product and period. In DINE OS, menu items hold a price, cost and tax rate, recipes are linked to ingredients so each sale deducts what it used, and waste is recorded with a reason. That makes the gap between recipe and actual food cost something you can look at, not guess at. Net profit margin still needs your rent, wages and other expenses, which is where a monthly profit and loss statement from your accountant comes in.
The bottom line
Food cost percentage is a control number for the kitchen: it tells you whether ingredients are being bought, stored and portioned the way you planned. Profit margin is a result number for the owner: it tells you whether the whole restaurant earns its keep. Watch food cost weekly, because small changes there flow straight to profit. Judge dishes by the rupees they earn as well as their percentage. And read the net profit margin monthly, because that is the number that pays you. To check a dish today, start with the food cost calculator, and see gross profit vs net profit for the wider picture.
Questions people ask
Is food cost percentage the same as profit margin?
No. Food cost percentage is a cost ratio: what ingredients take out of each ₹100 of sales. Profit margin is what is left over. A 30% food cost leaves a 70% gross margin before any other cost, but the net profit margin will be far lower once wages and rent are paid.
If my food cost is 30%, is my profit 70%?
No. The 70% is gross profit after ingredients only. Staff, rent, utilities, packaging, repairs and every other running cost still come out of it. In the example in this article, a 32% food cost ends as a 10% net profit margin.
What is prime cost in a restaurant?
Prime cost is food cost plus staff cost, usually shown as a percentage of sales. It groups the two costs a manager can influence most from week to week, so many owners watch it alongside food cost.
Should packaging count in food cost?
Keep it as a separate line so you can see it, but include it when you price delivery and takeaway dishes. The menu price calculator lets you add packaging to the ingredient cost before setting a price.
Should GST be included in food cost percentage?
No. Use menu prices before GST and ingredient costs as they actually fall on your business. GST collected on bills is not your income. For how GST applies to your restaurant, check with your accountant or the official GST portal.