The short answer
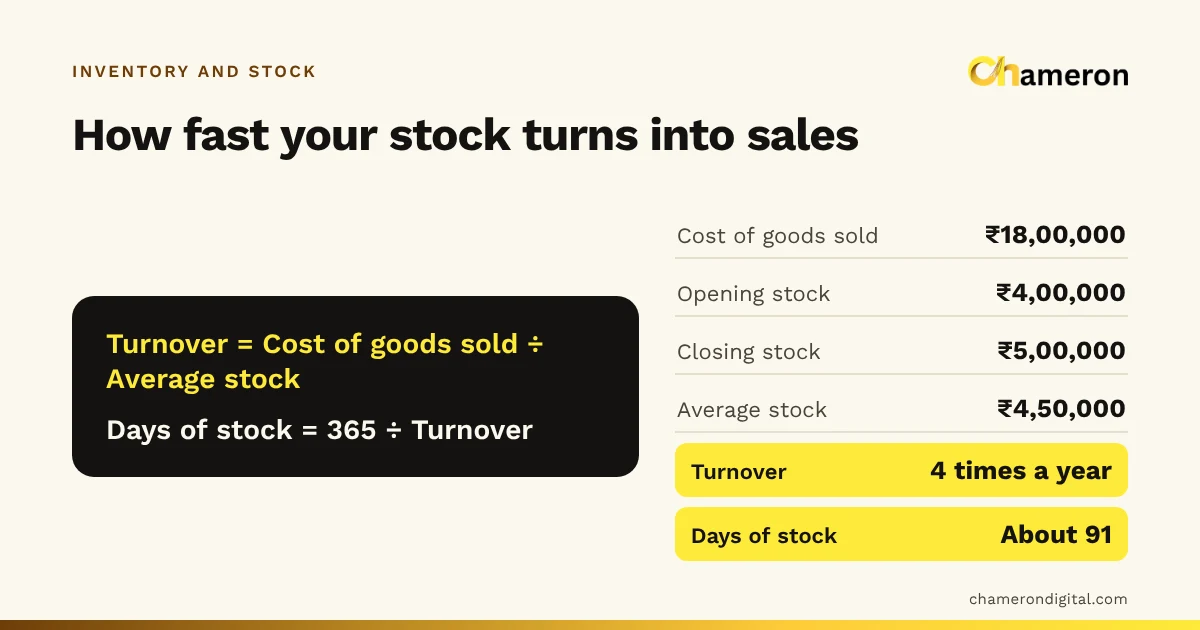
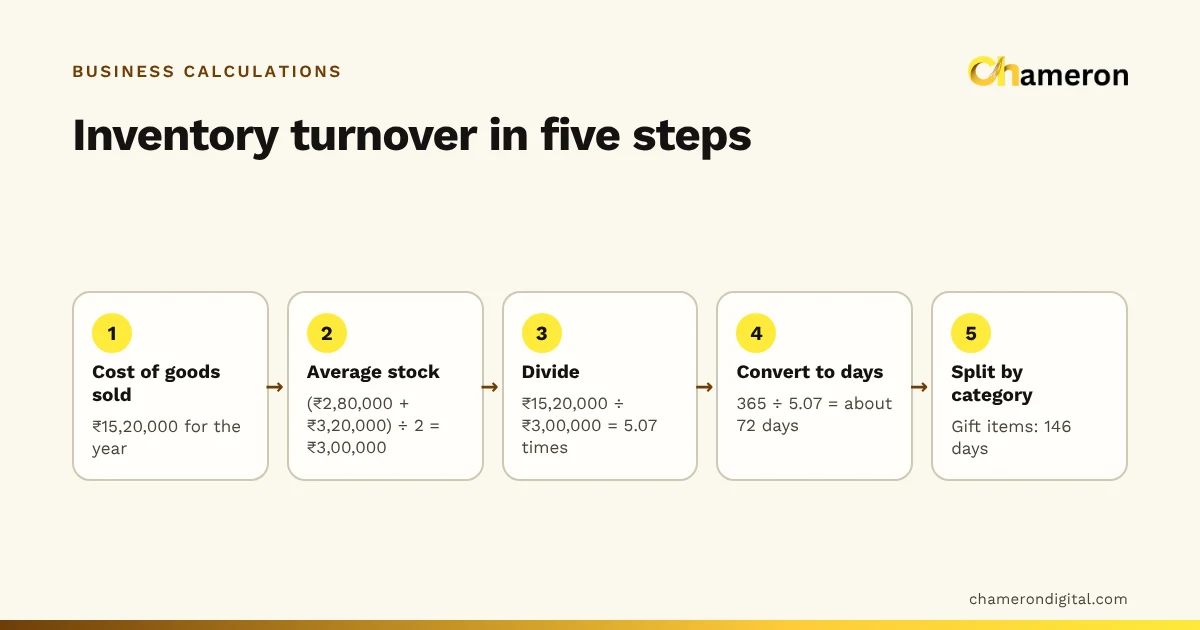
To calculate inventory turnover, divide the cost of goods sold for a period by the average value of stock you held during it, both at cost. Then divide the number of days in the period by that result to get days of stock on hand. For example, a shop with ₹15,20,000 cost of goods sold and ₹3,00,000 average stock turned its stock 5.07 times in the year, or held about 72 days of stock.
If you want to understand what turnover means and how to improve it first, read what inventory turnover is. This guide is the calculation itself.
What you need before you start
Collect four numbers for the period. All of them must be at cost and without GST you can claim back.
| Number | Where to find it |
|---|---|
| Opening stock value | Last period’s closing stock count, valued at cost |
| Purchases during the period | Purchase register or supplier bills, plus freight inwards, minus purchase returns |
| Closing stock value | A stock count on the last day, valued at cost |
| Days in the period | 365 for a year, 30 or 31 for a month, 91 or 92 for a quarter |
If your billing software records the cost of each item sold, its profit or cost-of-sales report may give you the cost of goods sold directly. Otherwise, work it out from stock and purchases as shown below. If you are not sure how to put a value on your stock, see how to calculate stock value.
Step-by-step: a full year
A stationery and gift shop’s figures for the financial year:
| Figure | Amount (at cost, before GST) |
|---|---|
| Opening stock, 1 April | ₹2,80,000 |
| Purchases, including freight, less returns | ₹15,60,000 |
| Closing stock, 31 March | ₹3,20,000 |
Step 1: Work out cost of goods sold
The logic: everything you had or bought during the year, minus what is still on the shelf, must have left the shop. Most of it was sold; some may have been damaged, stolen or given away, which is why accurate counts matter. Our answer on cost of goods sold explains what belongs in it.
Step 2: Work out average stock
Step 3: Divide
Step 4: Convert to days
A shortcut that avoids rounding: days of stock = days × average stock ÷ COGS = 365 × ₹3,00,000 ÷ ₹15,20,000 = 72.0 days. The inventory turnover calculator does steps 2 to 4 for you once you have the cost of goods sold.
Step 5: Sense-check the result
Before trusting the figure, ask whether it matches what you see. Seventy-two days means the shop holds about two and a half months of sales. If the shelves feel far fuller or emptier than that, recheck the stock counts and whether purchases include GST or items that are not stock, such as shop fittings or stationery for the office.
When two counts are not enough: seasonal stock
The simple average assumes stock moves smoothly between the two counts. Many shops do not work like that. This stationery shop loads up before the school year and before Diwali, so its stock in the middle of the year is far higher than at either end.
If it counts stock every quarter, it can average all five counts instead:
| Count date | Stock at cost |
|---|---|
| 1 April | ₹2,80,000 |
| 30 June | ₹3,10,000 |
| 30 September | ₹4,60,000 |
| 31 December | ₹3,50,000 |
| 31 March | ₹3,20,000 |
| Average of five counts | ₹17,20,000 ÷ 5 = ₹3,44,000 |
Now the turnover is ₹15,20,000 ÷ ₹3,44,000 = 4.42 times, and days of stock is 365 ÷ 4.42 = about 83 days. The two-count method understated the stock the shop really carried by ₹44,000 on average, and made it look 11 days faster than it was.
Monthly turnover and why it looks small
Monthly figures are useful because problems show up within weeks rather than at year-end. The same method applies; only the period changes.
October for the same shop, at cost:
- Cost of goods sold in October: ₹1,80,000
- Stock on 1 October: ₹4,60,000; on 31 October: ₹3,80,000
- Average stock: (₹4,60,000 + ₹3,80,000) ÷ 2 = ₹4,20,000
- Monthly turnover: ₹1,80,000 ÷ ₹4,20,000 = 0.43 times
- Days of stock: 31 ÷ 0.43 = about 72 days
A turnover of 0.43 looks alarming next to the yearly 5.07, but it is not comparable: one is per month and the other is per year. Days of stock removes the confusion. Multiplied across a year, 0.43 a month is about 5 times a year, roughly in line with the annual figure.
Use days of stock whenever you compare periods of different lengths. Track it month by month and a steady rise is an early warning that buying is running ahead of sales.
By category: finding where the cash is
Run the same calculation for each category. Here is the stationery shop’s year split four ways:
| Category | COGS | Average stock | Turnover | Days of stock |
|---|---|---|---|---|
| Notebooks and paper | ₹6,40,000 | ₹80,000 | 8.0 | 46 |
| Pens and art supplies | ₹4,20,000 | ₹70,000 | 6.0 | 61 |
| School bags | ₹1,60,000 | ₹30,000 | 5.3 | 68 |
| Gift items | ₹3,00,000 | ₹1,20,000 | 2.5 | 146 |
| Whole shop | ₹15,20,000 | ₹3,00,000 | 5.07 | 72 |
The whole-shop figure of 72 days hides the story. Gift items hold 40% of the stock value (₹1,20,000 of ₹3,00,000) but produce only about 20% of the cost of goods sold (₹3,00,000 of ₹15,20,000). That is the category to review first: what is not selling, what can be returned or cleared, and how much to buy next season.
To do this you need stock and purchases recorded by category, or a product list where each item belongs to one category. For the very top items, you can calculate turnover in units: units sold ÷ average units on hand.
Where the data comes from
| Approach | Cost of goods sold from | Stock value from | Good for |
|---|---|---|---|
| Paper and spreadsheets | Opening stock + purchase register − closing stock | Physical count × cost per item | Yearly or quarterly checks |
| Accounting books | Trading account or profit and loss statement | Closing stock in the books | Yearly figures checked by your accountant |
| Billing software with stock | Cost of items sold, from sales records | Inventory report at cost | Monthly and category-level figures |
Whichever source you use, check it against a physical count from time to time. A stock count sheet and a regular routine for stock count and reconciliation keep the numbers honest.
In BILL OS, every sale, return, delivery and approved count goes through one stock ledger, and inventory and margin reports can be exported to Excel, which gives you the inputs for a monthly or category calculation.
Common calculation mistakes
- Dividing sales by stock at cost. Sales include your margin, so turnover is overstated. Use cost of goods sold.
- GST in one figure but not the other. Keep claimable GST out of purchases and stock values alike.
- Counting on an unusual day. A count the morning after a big delivery inflates average stock. Count at the same point each period.
- Mixing periods. Monthly cost of goods sold divided by an annual average stock gives a meaningless number.
- Counting stock you do not own. Goods on consignment or held for a customer who has paid are not your stock.
- Forgetting the godown. Count every location where you keep stock, or turnover looks faster than it really is.
Conclusion
The calculation is short: cost of goods sold, divided by average stock at cost, then converted to days. The care goes into the inputs: counts on consistent dates, everything at cost and without claimable GST, and more than two counts if your business is seasonal. Calculate it monthly in days and by category, and the slow corners of the shop become obvious. Then use the ideas in what inventory turnover is to bring their days of stock down.
Questions people ask
What if I only know my stock value at the end of the year?
Use last year’s closing stock as this year’s opening stock; they are the same count. If you have never valued stock before, start now and use a single figure for one period, but treat the result as rough until you have two or more counts.
Can I calculate turnover in units instead of rupees?
Yes, for a single item: units sold ÷ average units on hand. An item that sold 240 units in a year with 30 on hand on average turned 8 times. For a whole shop or category, use rupees at cost, because units of different products cannot be added together meaningfully.
How do I annualise a monthly turnover figure?
Multiply it by the number of such periods in a year (roughly 12 for a month), or simply compare days of stock, which already puts every period on the same footing. Remember that a single month may not represent the whole year.
Should I include stock that is damaged or on order?
Include damaged stock you still own at its written-down value. Leave out goods that are only on order and have not arrived. Include goods in transit only if they are already yours, for example paid for and dispatched to you.