The short answer
Every small business owner should track ten numbers: net sales, gross margin, net profit, break-even sales, sales against target, average bill value, days of stock, dead stock, money customers owe and cash cover. Together they say whether the business makes money, whether the counter is performing, where cash is stuck and whether next month's bills can be paid. All ten come from ordinary records: bills, purchase bills, expenses, a stock count and the bank balance.
The example business
To keep the arithmetic connected, every number below uses one invented footwear shop and one month of 25 working days. All amounts are before GST.
| Record for the month | Amount |
|---|---|
| Gross sales (before returns and discounts) | ₹5,20,000 |
| Returns | ₹12,000 |
| Discounts given | ₹8,000 |
| Number of bills | 1,250 |
| Opening stock at cost | ₹6,40,000 |
| Purchases at cost | ₹2,50,000 |
| Closing stock at cost | ₹5,80,000 |
| Running expenses (rent, salaries, utilities and others) | ₹1,40,000 |
If you do not yet keep records like these, start with our guide on how to track sales and expenses.
Is the business making money?
1. Net sales
Sales are the starting point for everything else, but use the number customers actually paid, not the tag prices.
₹5,20,000 − ₹12,000 − ₹8,000 = ₹5,00,000.
Watch the gap between gross and net too. Here returns and discounts took ₹20,000, or 3.8% of gross sales. If that gap widens, ask why before celebrating a higher gross figure.
2. Gross margin
Gross margin is the share of each sale left after paying for the goods. It is the money that pays rent, salaries and everything else.
Cost of goods sold = ₹6,40,000 + ₹2,50,000 − ₹5,80,000 = ₹3,10,000. Gross profit = ₹5,00,000 − ₹3,10,000 = ₹1,90,000, a 38% gross margin.
Margin is often confused with markup; see profit margin vs markup, or check your own items with the margin and markup calculator.
3. Net profit and net margin
Net profit is what is left after running expenses as well.
₹1,90,000 − ₹1,40,000 = ₹50,000, a 10% net margin. The difference between the two profits is explained on gross profit vs net profit.
4. Break-even sales
Break-even is the sales figure at which gross profit exactly covers running expenses. The distance between actual sales and break-even is your safety margin.
₹1,40,000 ÷ 0.38 = ₹3,68,421. Sales could fall by ₹1,31,579, or 26.3%, before the shop stops making a profit. Our guide to calculating break-even point goes further, and the break-even calculator does the arithmetic.
Is the counter performing?
5. Sales against target
A monthly target turns "we should sell more" into a daily number staff can act on. Checking it mid-month matters more than checking it at the end.
The shop's target was ₹5,50,000. By day 20 it had sold ₹4,00,000, a run rate of ₹20,000 a day. To reach target it needed (₹5,50,000 − ₹4,00,000) ÷ 5 = ₹30,000 a day for the last five days. It kept its usual pace and finished at ₹5,00,000, or 90.9% of target. Seen on day 20, that gap was a prompt to plan a weekend display or call regular customers. See how to set a monthly sales target and the sales target calculator.
6. Average bill value
Sales can grow because more customers come in, or because each one spends more. Average bill value separates the two.
₹5,00,000 ÷ 1,250 bills = ₹400 per bill, from 50 bills a day. Socks, polish and insoles at the counter raise this number; a month of discount-driven bargain hunters lowers it. More on the average bill value question page.
Is money stuck in the business?
7. Days of stock (and turnover)
Stock is cash sitting on a shelf. Days of stock tells you how long, at the current rate of sale, the stock you hold would last.
Average stock = (₹6,40,000 + ₹5,80,000) ÷ 2 = ₹6,10,000. Days of stock = ₹6,10,000 ÷ ₹3,10,000 × 30 = about 59 days. That is a turnover of roughly 6.1 times a year. Falling from 59 days towards 45 would free cash without losing sales, if the right items stay in stock. Read how to calculate inventory turnover or use the inventory turnover calculator.
8. Dead stock
Turnover is an average, and averages hide the shoes nobody has wanted since last season. Track stock that has not sold for a fixed period, often 90 days.
₹69,600 of the shop's ₹5,80,000 closing stock has not sold in 90 days: 12%. That is about half a month of the shop's running expenses, sitting on a shelf. Clearance, bundles or a supplier return are usually better than waiting. See what dead stock is.
9. Money customers owe you
Credit sales count as sales, but they are not cash until collected. Measure both the amount and how long it takes to come in.
Customers owe ₹45,000, and this month's credit sales were ₹90,000. Credit days = ₹45,000 ÷ ₹90,000 × 30 = 15 days. List separately anyone who has owed money for more than 30 days; that list matters more than the average.
Can you pay next month's bills?
10. Cash cover
Profit is an opinion about the month; cash is a fact about today. Cash cover says how many months of running expenses you could pay from the money you have.
The shop has ₹2,10,000 in the drawer and bank, which looks like 1.5 months of expenses. But it owes suppliers ₹1,00,000 for this month's purchases. After paying them: (₹2,10,000 − ₹1,00,000) ÷ ₹1,40,000 = about 0.8 months. A healthy profit and less than a month of cash cover can exist together, which is why this number is worth checking every week.
All ten on one page
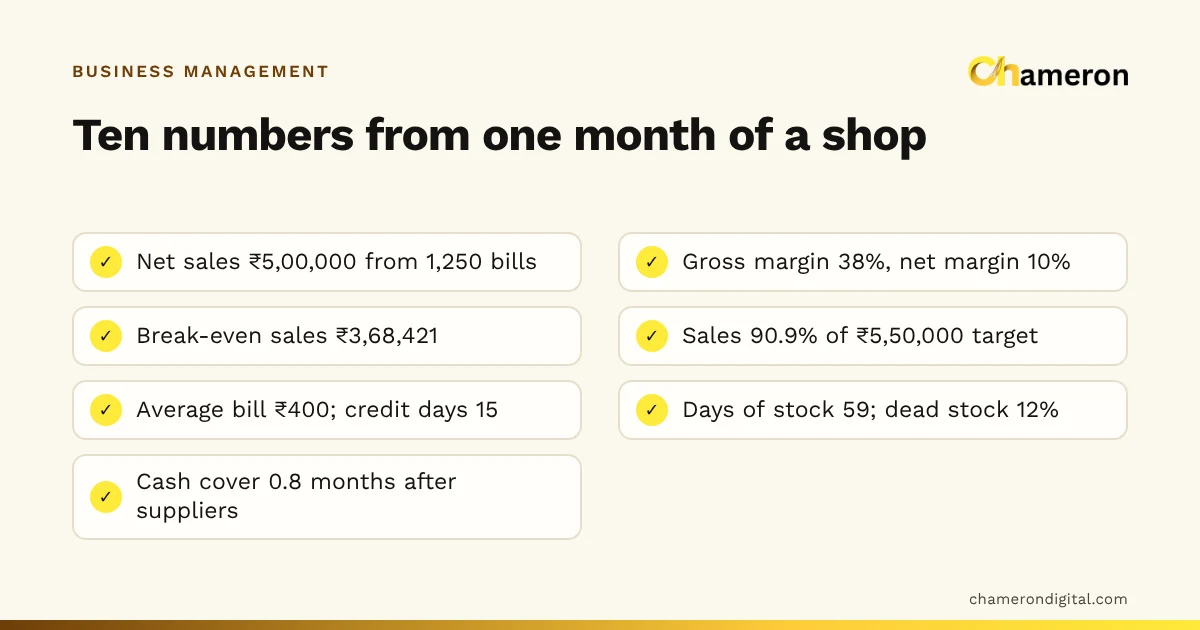
| # | Number | This month | Check |
|---|---|---|---|
| 1 | Net sales | ₹5,00,000 | Monthly |
| 2 | Gross margin | 38% | Monthly |
| 3 | Net profit | ₹50,000 (10%) | Monthly |
| 4 | Break-even sales | ₹3,68,421 | Monthly |
| 5 | Sales against target | 90.9% | Weekly |
| 6 | Average bill value | ₹400 | Weekly |
| 7 | Days of stock | 59 days | Monthly |
| 8 | Dead stock | 12% | Monthly |
| 9 | Credit days | 15 days | Weekly |
| 10 | Cash cover | 0.8 months | Weekly |
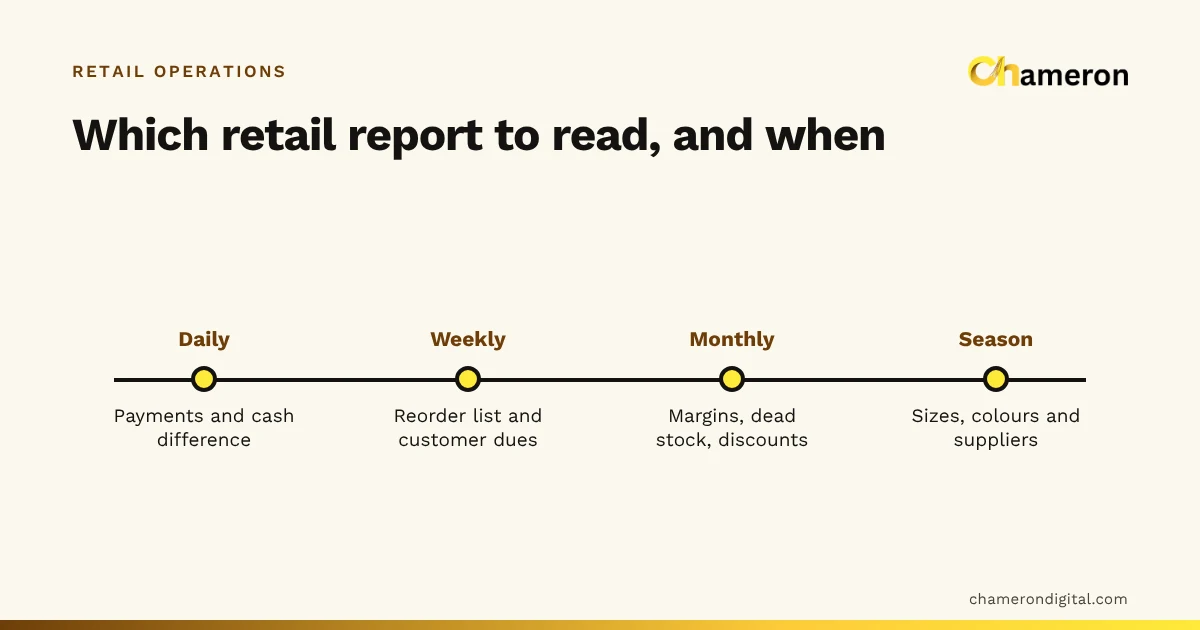
Copy this table into a notebook or sheet and add a column each month. A single month tells you little; the direction over three or four months tells you a lot. Our guide to the retail reports that matter shows which reports supply each figure.
Common mistakes
- Using purchases instead of cost of goods sold. A month of heavy buying then looks like a loss and the next month looks unusually good.
- Including GST. Sales and costs with GST inflate the totals and distort every percentage.
- Ignoring returns and discounts. Gross sales overstate what customers actually paid.
- Treating profit as cash. Credit sales and stock both absorb cash; check cash cover separately.
- Tracking too many numbers. Twenty figures nobody reads are worse than ten that are reviewed every month.
- Comparing with a guess. Compare each number with your own last month and the same month last year.
Getting the numbers from software
Most of these numbers need the same three inputs: sales by bill, cost prices against each item, and a stock figure you trust. Billing software that records cost prices produces several of them directly. BILL OS, for example, includes sales, profit, margin, customer outstanding, dead stock and payment method reports, each downloadable as Excel or CSV, as described under reports and exports. Cash cover and the break-even calculation still need you to bring in the bank balance and expenses.
The bottom line
These ten numbers answer four questions: are we making money, is the counter performing, is cash stuck, and can we pay next month's bills. Work them out from sales and costs before GST, put them on one page, and compare each with last month. When one moves the wrong way, the formula tells you exactly which record to look at first.
Questions people ask
How often should I check these numbers?
Sales against target and average bill value are worth a glance daily or weekly. Margins, net profit, break-even, stock days and dead stock are monthly numbers. Check customer credit weekly and cash every week before supplier payments are due.
Which number matters most for a new business?
Cash cover and break-even. A new business can show a profit on paper and still run out of cash, so know how many months of expenses you can pay and how much you must sell each month to cover costs.
Should these numbers include GST?
No. Use sales and costs before GST. GST collected is owed to the government and GST paid on purchases is usually claimed back, so including it inflates sales and distorts margins. Check your own GST position with your accountant.
Where do I get these numbers if I use a notebook?
From your bill book, purchase bills, expense notes, a monthly stock count and the bank statement. The method in how to track sales and expenses sets those records up so the numbers fall out at month end.
What is a good gross margin?
It depends on the trade, the location and how fast stock sells. Instead of chasing a benchmark, make sure your margin covers your expenses with room to spare, which is what the break-even number tells you.